Blog
-
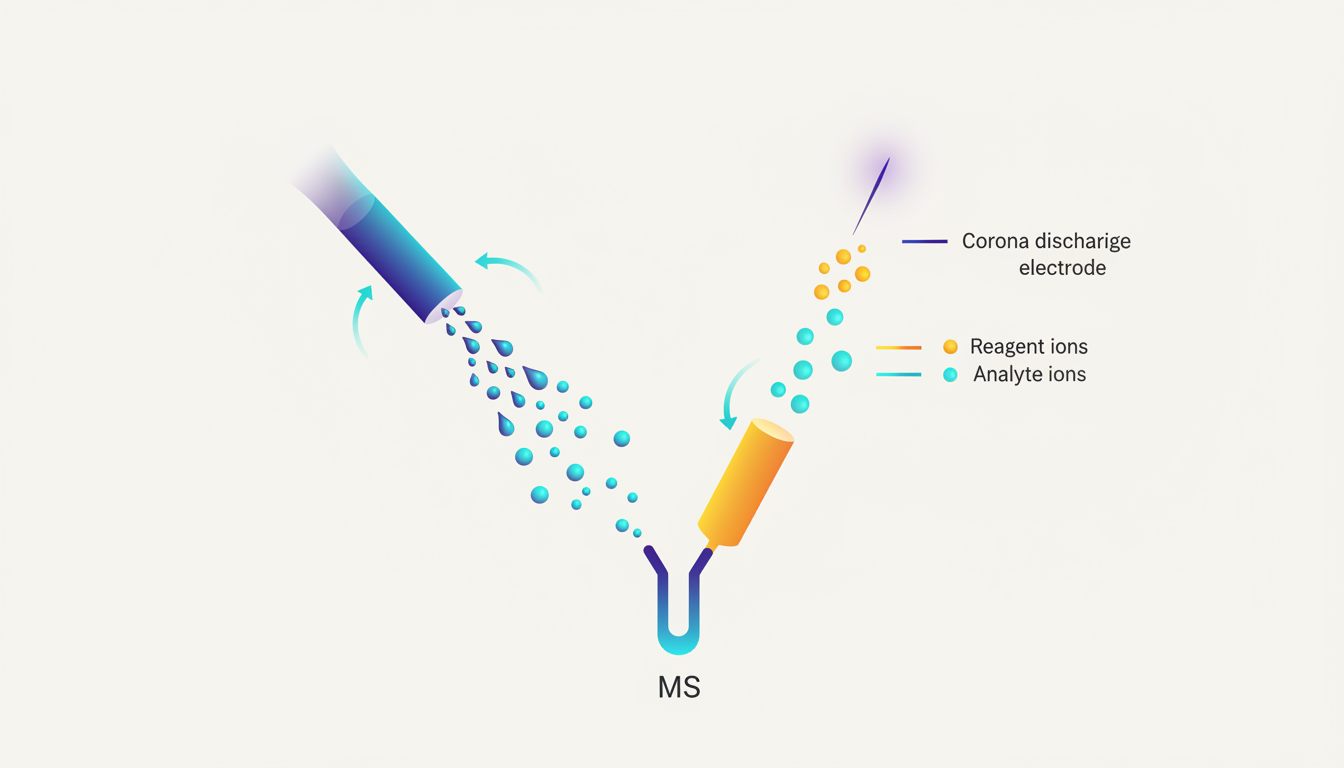
ESI vs APCI Explained Visually: Two Ways to Ionize LC-MS Samples
Electrospray versus atmospheric-pressure chemical ionization explained visually: liquid droplets, vaporization, corona discharge and choosing a source.
-

Signal-to-Noise, LOD and LOQ Explained: When Is an LC-MS Peak Real?
Understand signal-to-noise ratio, detection limits and quantitation limits in LC-MS with visual plots, practical caveats and a quiz.
-

Positive vs Negative ESI in LC-MS: Which Polarity Detects Your Molecule?
Positive and negative ESI ionization explained visually: protonation and deprotonation, example ions, mobile-phase chemistry, polarity switching and a quiz.
-

Retention Time vs Dead Time vs Retention Factor: The HPLC Race Explained
A friendly diagram and worked example showing HPLC dead time t0, retention time tR and retention factor k, with student…
-
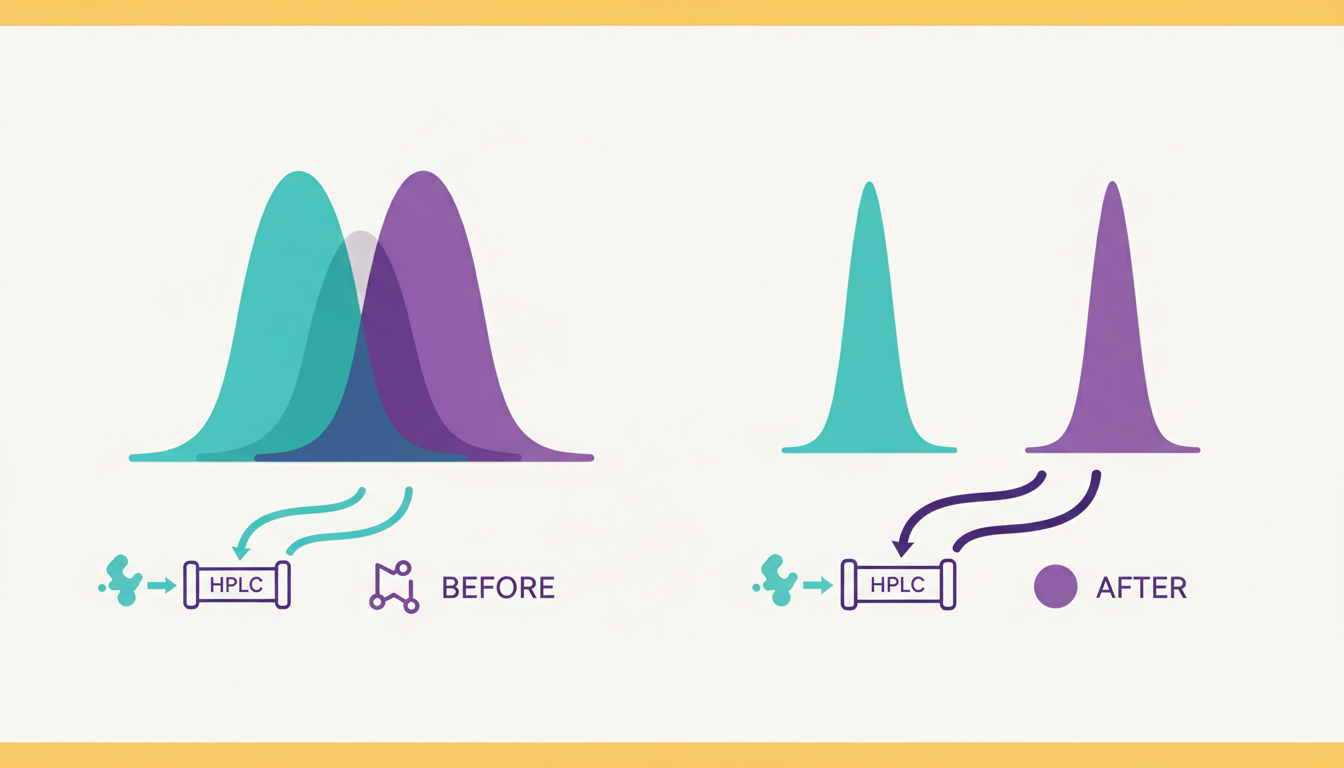
Chromatographic Resolution Explained with Two Peaks: What Does Rs Mean?
Understand chromatographic resolution using overlapping peaks, retention-time differences and peak widths. A visual HPLC explanation with an example.
-

LC-MS Calibration Curves Explained: Turning Peak Area into Concentration
Calibration curves in LC-MS/MS explained visually for students: standards, peak areas, slope and intercept, unknown concentration and common calibration mistakes.
-

What Is MS/MS? A Visual Introduction to Tandem Mass Spectrometry
MS/MS explained for students using a molecule, a collision cell and fragment peaks. Learn precursor ions, CID, product ions and…
-
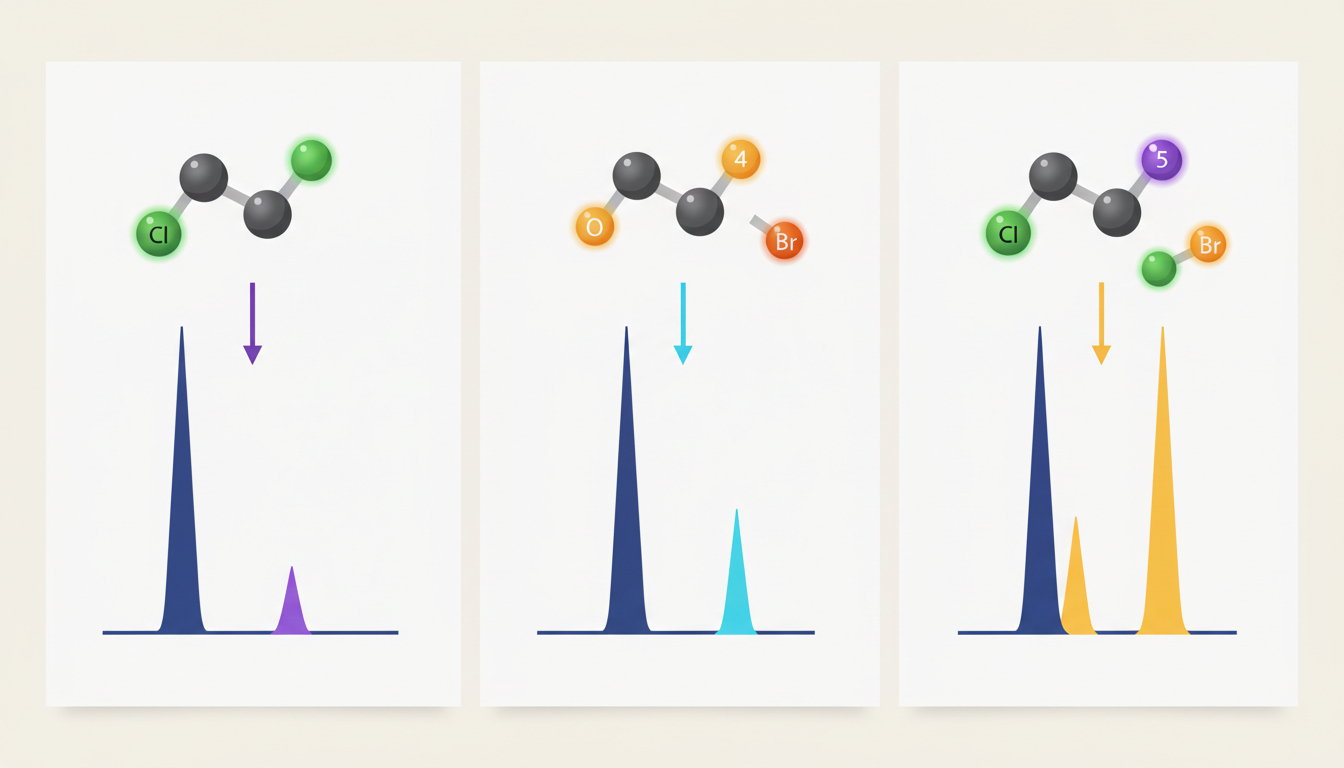
Mass Spectrometry Isotope Patterns: Why M+1 and M+2 Peaks Appear
Learn isotope patterns in mass spectrometry visually: 13C produces M+1, chlorine shows about 3:1 M to M+2, and bromine about…
-

TIC vs BPC vs XIC: Read Three LC-MS Chromatograms Like a Detective
TIC, BPC and XIC (EIC) explained with simple illustrations, a worked scan example and a student quiz about reading LC-MS…
-

Electrospray Ionization (ESI) Explained Visually: From a Liquid Drop to an Ion
Electrospray ionization explained with a visual four-step diagram: Taylor cone, charged droplets, evaporation and gas-phase ions. A beginner-friendly LC-MS lesson.
Categories
- Characteristic Fragments (8)
- HPLC & LC Troubleshooting (5)
- HPLC Fundamentals (13)
- LC-MS Troubleshooting (1)
- Literature Watch (2)
- Mass Spectrometry (26)
- Method Development (21)
- Resources (1)
Recent posts
- ESI vs APCI Explained Visually: Two Ways to Ionize LC-MS Samples
- Signal-to-Noise, LOD and LOQ Explained: When Is an LC-MS Peak Real?
- Positive vs Negative ESI in LC-MS: Which Polarity Detects Your Molecule?
- Retention Time vs Dead Time vs Retention Factor: The HPLC Race Explained
- Chromatographic Resolution Explained with Two Peaks: What Does Rs Mean?
- LC-MS Calibration Curves Explained: Turning Peak Area into Concentration
- What Is MS/MS? A Visual Introduction to Tandem Mass Spectrometry
- Mass Spectrometry Isotope Patterns: Why M+1 and M+2 Peaks Appear