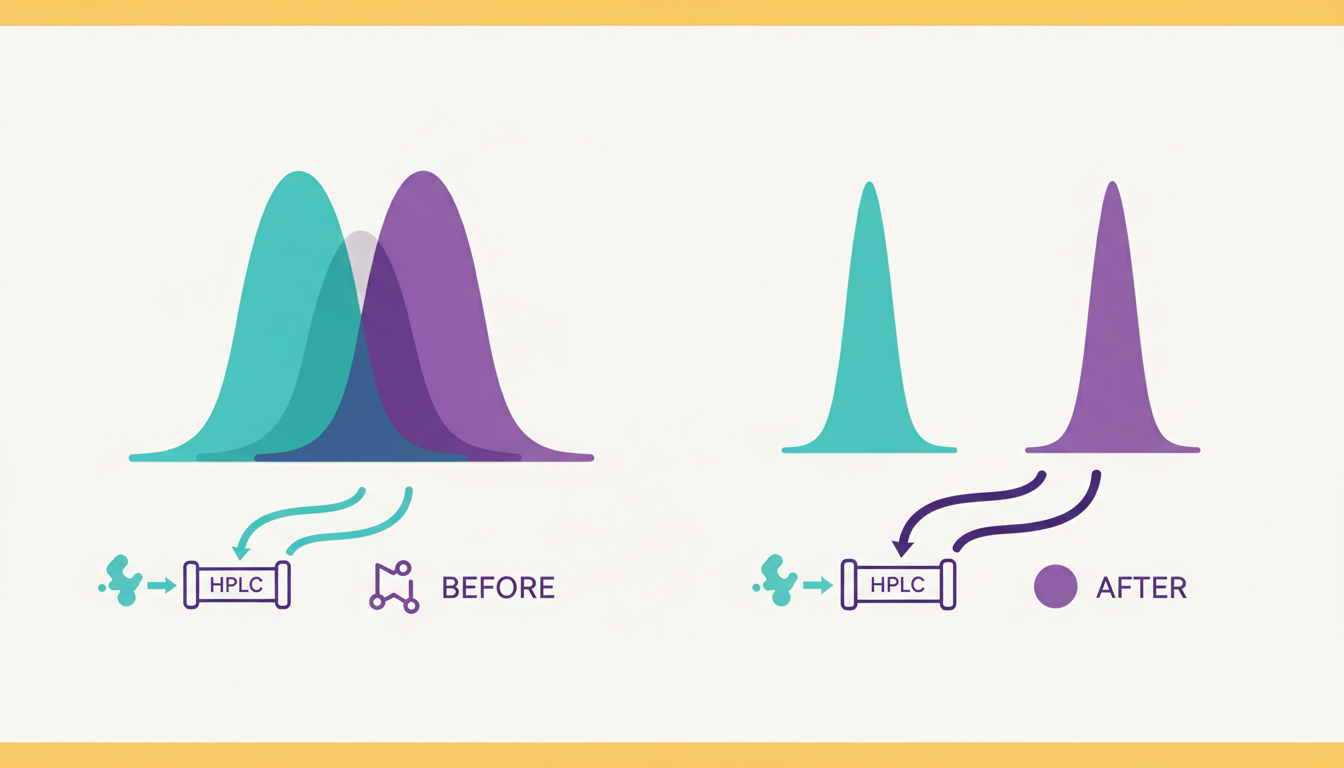
Beginner-friendly visual lesson: Understand chromatographic resolution using overlapping peaks, retention-time differences and peak widths. A visual HPLC explanation with an example.

Follow the picture in four steps
| 🔵 Step 1
Two compounds leave the column at different times |
🟣 Step 2
Each compound makes a chromatographic peak |
🟡 Step 3
Their retention times and peak widths determine how much peaks overlap |
🟢 Step 4
Better selectivity or efficiency may improve resolution |
Two runners finishing together
Imagine two runners crossing a finish line. If they arrive at almost exactly the same moment, it is difficult to tell them apart in a blurred photograph. If one arrives later, identification becomes easy. Chromatographic resolution measures a similar effect: how clearly two peaks are separated.
The picture: same peaks, different separation
Look at the illustrated before-and-after chromatograms. The left peaks overlap so that measurements may interfere. On the right, the peaks are distinct. A better separation helps identify and quantify individual compounds.
Calculate Rs with a classroom example
For roughly Gaussian peaks measured using baseline widths, a familiar resolution calculation is Rs = 2(tR,2 − tR,1)/(w1 + w2). Retention times and widths must use the same time units and the chosen width convention.
| Peak | Retention time | Baseline width |
|---|---|---|
| 1 | 4.0 min | 0.4 min |
| 2 | 4.6 min | 0.4 min |
Rs = 2 × (4.6 − 4.0)/(0.4 + 0.4) = 1.5. For two symmetrical, equally sized Gaussian peaks, Rs around 1.5 is commonly associated with approximate baseline separation. The practical adequacy of a result depends on peak shape, detector response and method requirements; 1.5 is not a universal rule.
How to improve resolution
- Change selectivity: change stationary phase, pH or mobile phase if appropriate.
- Adjust retention: modify gradient or solvent strength so closely eluting species separate in time.
- Improve efficiency: consider column dimensions, particle size, flow, extra-column effects and injection conditions.
- Check overload: very large injections may broaden or distort peaks.
What resolution does NOT tell you
A large Rs value alone says little about absolute recovery, mass accuracy or whether the peaks belong to the intended compounds. It is one measure within a complete analytical method.
Read more: Causes of Split Peaks and How to Read a Chromatogram.
Quick student quiz
- If retention times are farther apart while peak widths stay the same, does Rs rise or fall?
- What is Rs for tR values 4.0 and 4.6 min with both baseline widths 0.4 min?
- Does Rs=1.5 guarantee every method will meet its requirements?
Reveal the answers
- It rises.
- 1.5.
- No; peak shape and assay requirements matter.
Further reading
All figures and worked examples are educational illustrations, not substitute measurements for a validated laboratory procedure.