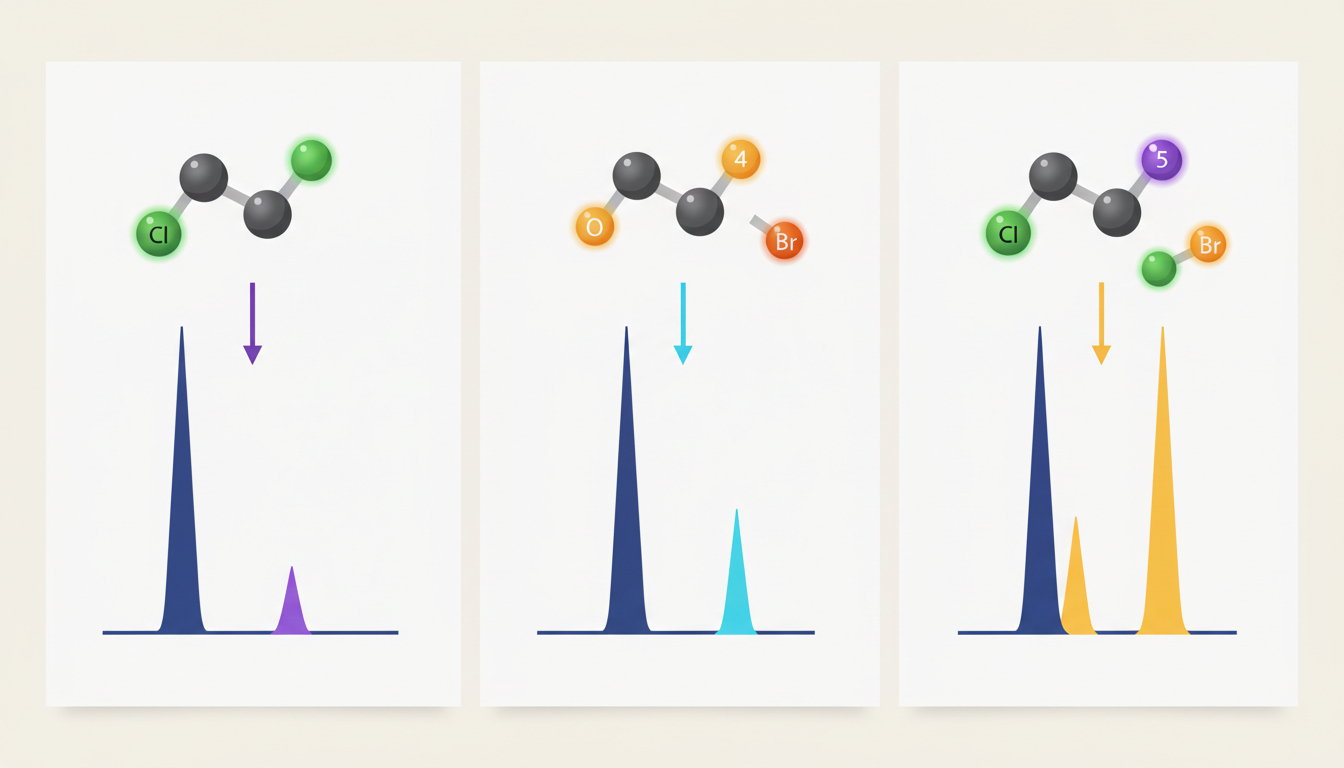
For students and curious beginners: An ion may show a large peak and several smaller partners. These are often isotope peaks, not laboratory contamination. Their pattern can even reveal which elements are present.

See the big picture
| 🔵 1. Main peak M
The most abundant isotope combination produces a signal. |
🟣 2. M+1 neighbor
A heavier isotope such as 13C creates a partner. |
🟡 3. M+2 pattern
37Cl or 81Br can create a distinctive second partner. |
🟢 4. Match chemistry
Use isotope ratios to test proposed formulas. |
Think of identical-looking coins that weigh a little differently
Most carbon atoms in ordinary organic molecules are carbon-12, but a small proportion are carbon-13. They behave nearly the same chemically, yet one carbon-13 atom makes the molecule roughly one dalton heavier. The mass spectrometer can often distinguish the resulting isotope-containing ions.
The carbon-13 M+1 clue
Natural carbon contains about 1.1% carbon-13. For small molecules, each carbon atom increases the approximate abundance of an M+1 isotope peak relative to M. As a quick rule of thumb, a molecule with 10 carbon atoms may have an M+1 peak around 11% of the M peak. This is not an exact carbon-counting method: nitrogen, sulfur, oxygen isotopes, overlaps and charge state affect observed clusters.
Chlorine versus bromine: two easy visual clues
| One halogen | Natural abundance pattern | Typical M:M+2 appearance |
|---|---|---|
| One chlorine | 35Cl ≈ 75.8%; 37Cl ≈ 24.2% | ≈ 3:1 |
| One bromine | 79Br ≈ 50.7%; 81Br ≈ 49.3% | ≈ 1:1 |
The nominal gap is two mass units for singly charged ions. In high-resolution data, exact isotope mass separations must be used rather than treating every isotope difference as precisely 2.0000 Da.
What happens with two chlorine atoms?
There are three broad possibilities: neither chlorine atom is heavy; one is heavy; or both are heavy. The approximate pattern becomes M : M+2 : M+4 ≈ 9 : 6 : 1. For two bromines it is approximately 1 : 2 : 1. This is an application of elementary probability: different combinations of isotope atoms add their probabilities together.
Worked student example
You see two large isotope peaks separated by about two mass units and almost equal in intensity. A molecule with one bromine becomes a plausible candidate. That is a clue, not proof: check the accurate isotope masses, candidate molecular formula, adduct identity and MS/MS.
Two mistakes to avoid
- Calling every taller peak a completely new chemical: isotope partners can belong to the same compound.
- Confusing the M+2 pattern from a heavy isotope with a fragment loss or sodium adduct, which follow different mass differences.
Why this matters in untargeted LC-MS
Correct isotope grouping reduces false chemical counts and supports elemental-composition annotation. If the pattern does not fit the formula, revisit the charge state, peak interference or molecular identity.
Related: Characteristic Fragments of Sulfonamides; Chlorine Isotopes and the +16 Shift.
Test yourself (answers below)
- An M+2 peak about one-third of M suggests which halogen?
- Why does a carbon-rich compound often have a visible M+1 peak?
- Are isotope peaks separate compounds?
Reveal the answers
- Chlorine, if a single halogen is responsible.
- Natural abundance of carbon-13.
- No; they are isotopic forms of ions from the same chemical species.
Learn more: reliable references
Educational note: The images and numerical examples are schematic. Real LC-MS methods depend on analyte, instrument and laboratory conditions.