HPLC troubleshooting
Sample Solvent and Gradient Mismatch in HPLC: Why Peaks Split, Front or Broaden
A new column is installed, pressure is stable and the standard is chemically pure—yet the first peaks are broad, fronting or even split. Before replacing the column, inspect the liquid in the sample vial. A few microlitres of the wrong solvent can temporarily rewrite the initial gradient at the column inlet.

What actually happens during the injection?
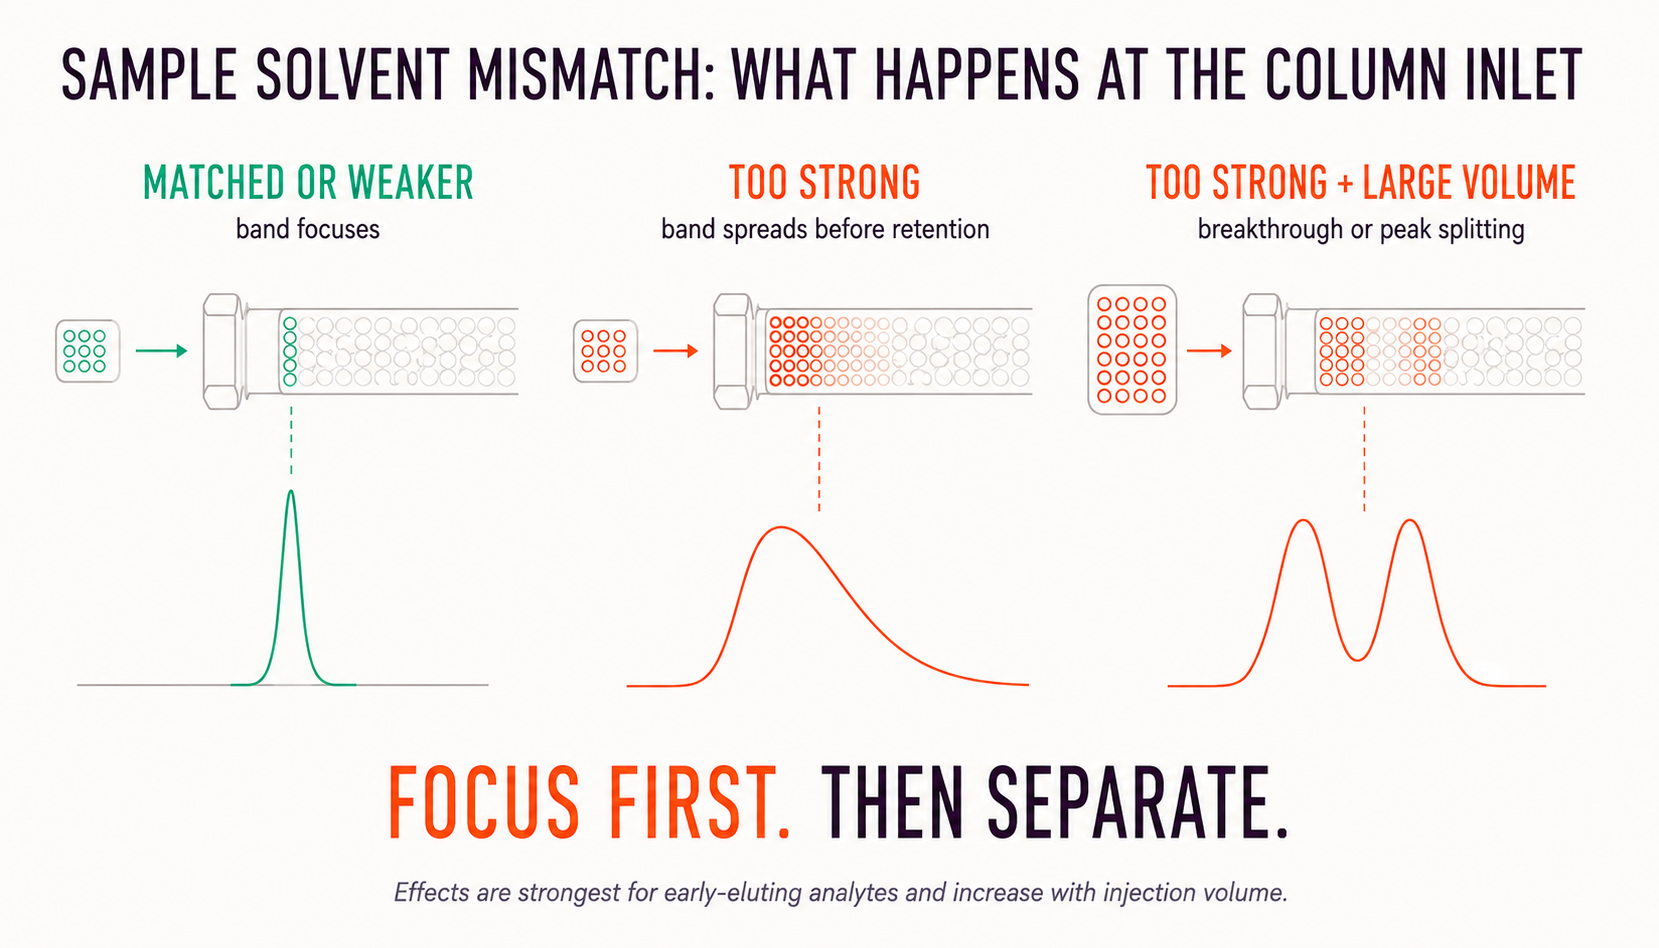
The autosampler does not place an infinitesimally thin line of analyte on the stationary phase. It inserts a finite plug containing sample, solvent and matrix. That plug travels through the injector and capillaries, reaches the column, and mixes with the initial mobile phase.
Under favorable conditions, the initial mobile phase retains the analyte at the head of the column. Molecules entering at slightly different times are compressed into a narrow band—often called on-column focusing. The gradient then increases in elution strength and moves the compact band through the column.
If the sample solvent is substantially stronger than the initial mobile phase, the analyte has a lower local retention factor inside that plug. The front of the band may travel while analyte at the rear is already encountering weaker mobile phase and becoming retained. The zone stretches, becomes asymmetric or develops two populations. Modeling and experiments show that a sufficiently strong mismatch can produce a bimodal distribution rather than simple Gaussian broadening.3
This is why the chromatogram can look like a damaged column even though the stationary phase is perfectly healthy.
The chromatographic fingerprints
Sample-solvent mismatch usually affects early and weakly retained compounds first. Common observations include:
- broad or flat-topped early peaks;
- peak fronting, shoulders or two maxima;
- apparent loss of retention or partial breakthrough;
- lower peak height despite similar peak area;
- poorer resolution between the first pair of peaks;
- peak shape that worsens as injection volume increases;
- standards behaving differently from matrix samples because their diluents differ;
- acceptable late peaks while only the front of the chromatogram looks wrong.
Waters documented fronting when samples prepared in 50:50 acetonitrile/water were injected into a reversed-phase gradient starting at only 5% acetonitrile. Reducing the sample diluent to 10% acetonitrile restored good symmetry at the tested volume.7 Shimadzu likewise reports that deterioration becomes more pronounced as both solvent strength and injection volume increase.5
“Strong” means the opposite in RP-LC and HILIC

Reversed-phase LC
In RP-LC, increasing acetonitrile, methanol or another organic modifier generally increases elution strength. A sample dissolved in neat ACN, MeOH, IPA or a high percentage of organic solvent may therefore be much stronger than a gradient beginning at 2–10% B. The early analytes are exposed to a local high-%B zone before the programmed gradient reaches them.
HILIC
In HILIC, acetonitrile-rich mobile phase is weak and increasing the aqueous fraction is strong. A highly aqueous extract can disrupt partitioning into the water-enriched stationary-phase layer, reduce retention and cause broadening, breakthrough or splitting. Waters specifically lists excess water in the sample diluent as a cause of HILIC peak splitting, while Thermo Fisher recommends matching the initial conditions or retaining at least substantial organic content.9, 10
| Mode | Typical weak conditions | Typical strong-solvent mismatch | First adjustment |
|---|---|---|---|
| RP-LC | Water-rich initial mobile phase | Sample contains much more ACN, MeOH, IPA or DMSO than the initial mobile phase | Reduce organic content or injection volume |
| HILIC | ACN-rich initial mobile phase | Sample is too aqueous | Increase ACN where solubility permits or reduce volume |
| Ion-pair RP-LC | Initial mobile phase containing the required ion-pair environment | Sample lacks buffer/ion-pair reagent or has incompatible salt and pH | Match composition beyond just % organic |
| Ion exchange | Low ionic-strength starting eluent | Sample has much higher salt concentration | Dilute, desalt or reduce injection volume |
The fastest diagnostic experiment
Do not start by changing the gradient, column or source. Run a small controlled experiment that changes one variable at a time.
- Prepare solution A in the current sample solvent. This reproduces the problem.
- Prepare solution B in the exact initial mobile phase. Keep analyte concentration and injected amount identical.
- Inject both at a small volume. For example, compare 1–2 µL before testing the routine volume; choose a scale appropriate for your column.
- Compare the earliest affected peak. If solution B becomes narrow and symmetric, solvent mismatch is strongly supported.
- Run a volume series. Hold the absolute analyte amount constant by adjusting concentration. If distortion grows with plug volume, the diagnosis becomes stronger.
Corrective actions—in the order I would try them
1. Match the initial mobile phase
This is the cleanest solution when the analytes remain soluble and stable. Match not only the organic ratio but also pH, buffer and relevant additives. In a Waters HILIC investigation, preparing cetirizine in the specified mobile phase produced Gaussian peaks across a wide injection-volume series, which prompted separate evaluation of organic mismatch and pH/buffer mismatch.8
2. Use the weakest solvent that maintains solubility
“Use water” is not a universal instruction. For RP-LC, move the diluent toward the aqueous initial condition. For HILIC, move it toward higher ACN. Confirm that the sample remains clear after standing in the vial and after mixing with the initial mobile phase. A perfect chromatogram is irrelevant if hydrophobic analytes precipitate on dilution.
3. Reduce injection volume
The chromatographic disturbance is created by the volume and composition of the solvent plug, not only by the analyte mass. Reducing 10 µL to 1–2 µL can improve focusing even when the diluent cannot be fully changed. Maintain sensitivity by concentrating the sample if solubility and detector response permit.
4. Increase initial retention—but carefully
In RP-LC, a more aqueous start or a short initial hold can improve focusing. In HILIC, a more ACN-rich start may do the same. However, changing initial conditions also changes selectivity, equilibration and retention. It is a method modification, not merely an injection correction.
5. Dilute inside the autosampler or flow path
When sample preparation demands a strong solvent, modern injectors can mix or bracket the plug with weak solvent. Shimadzu describes co-injection of a dilution solvent; Agilent’s Feed Injection mixes sample into the mobile-phase stream; Thermo Fisher describes strong-solvent-loop and custom-injection-program approaches. These are useful engineering options, but they must be verified for recovery, carryover, precision and band dispersion.11–13
6. Consider a trapping or focusing strategy
Online SPE, trap columns or at-column dilution can decouple sample solubility from analytical-column loading. They add valves and method complexity, but can be the correct answer for large-volume trace analysis.
Solvent strength is not the whole story
Viscosity mismatch
A solvent plug can be hydrodynamically unstable when its viscosity differs from the mobile phase. The resulting “viscous fingering” can produce front or tail distortions, shoulders and poor repeatability. Peer-reviewed RPLC studies found that the effect is strongest for poorly retained analytes that migrate close to the sample solvent, and worsens with larger injection volume in relevant systems.2, 4
DMSO and high-organic standards
DMSO is common for stock solutions but is viscous and may be chromatographically strong. Keep it low in the final injected solution, prepare an intermediate dilution and verify analyte solubility after dilution. Standards supplied in neat ACN or MeOH should not automatically be injected directly into a water-rich gradient.
pH, buffer and ionic strength
If the analyte is ionizable, the sample plug may impose a different charge state at the column inlet. Missing buffer or ion-pair reagent, high salt, or a pH far from the initial mobile phase can shift retention and distort peak shape even when the organic fraction matches. Oligonucleotide RP-IP methods are particularly sensitive because salts and ion-pair formation alter the retention mechanism.
Sample overload
Mass overload can also cause fronting. Distinguish the two mechanisms by reducing solvent volume while keeping analyte mass constant, then reducing analyte mass while keeping solvent composition constant. Solvent effects respond strongly to the first experiment; mass overload responds to the second.
Quick troubleshooting table
| Observation | Likely solvent-related explanation | Confirmation | Action |
|---|---|---|---|
| Only early RP peaks front or broaden | Sample has too much organic solvent | Reprepare in initial mobile phase | Reduce % organic and/or volume |
| HILIC peaks split or break through | Sample is too aqueous | Increase ACN in the diluent | Use ACN-rich diluent compatible with solubility |
| Defect worsens with volume | Strong solvent plug or viscosity mismatch | Volume series at constant mass | Reduce volume or use at-line/on-line dilution |
| Shape varies between replicate injections | Possible viscous fingering or incomplete mixing | Match mobile-phase viscosity/composition | Reformulate diluent; inspect injector mixing |
| Retention changes although % organic matches | pH, buffer, salt or ion-pair mismatch | Match full initial composition | Adjust pH/additives or desalt |
| All peaks deteriorate over time | Probably not only solvent mismatch | Inject established system-suitability standard | Check column, guard, connections and contamination |
Bottom line
The sample vial is part of the chromatographic method. A strong or incompatible injection plug can prevent focusing at the column head and create broad, fronting, shouldered or split peaks—especially for early analytes and large injection volumes.
The fastest fix is also the best diagnostic test: prepare the same analyte in the initial mobile phase and inject a smaller volume. If peak shape recovers, optimize the weakest soluble diluent before changing the column or gradient. Remember the reversal: organic solvent is typically strong in RP-LC, while water is strong in HILIC.
References and further reading
- Vukmanic, D.; Chiba, M. Effect of organic solvents in sample solutions and injection volumes on chromatographic peak profiles of analytes in reversed-phase HPLC. J. Chromatogr. A 1989, 483, 189–196. DOI: 10.1016/S0021-9673(01)93121-8.
- Castells, C. B.; Castells, R. C. Peak distortion in reversed-phase liquid chromatography as a consequence of viscosity differences between sample solvent and mobile phase. J. Chromatogr. A 1998, 805, 55–61. DOI: 10.1016/S0021-9673(98)00042-9.
- Mishra, M.; Rana, C.; De Wit, A.; Martin, M. Influence of a strong sample solvent on analyte dispersion in chromatographic columns. J. Chromatogr. A 2013, 1297, 46–55. DOI: 10.1016/j.chroma.2013.04.025.
- Keunchkarian, S.; Reta, M.; Romero, L.; Castells, C. Effect of sample solvent on chromatographic peak shape under reversed-phase conditions. J. Chromatogr. A 2006, 1119, 20–28. DOI: 10.1016/j.chroma.2006.02.006.
- Shimadzu. Effects of Sample Solvents on Peak Shape. Technical support article.
- Thermo Fisher Scientific. HPLC Troubleshooting: Split or Double Peaks.
- Waters. Peak Shape Changes with Increased Injection Volume. HPLC Troubleshooting Primer.
- Waters. Modernization and Troubleshooting of the USP Cetirizine Impurity Method. Application note, 2017.
- Waters. How to Minimize Peak Splitting in HILIC. Knowledge base article.
- Thermo Fisher Scientific. HILIC Troubleshooting.
- Shimadzu. Nexera Series Co-Injection Feature.
- Agilent. Hybrid Multisampler Series with Feed Injection.
- Thermo Fisher Scientific. Evaluation of Custom Injection Programs and Strong Solvent Loop. Technical note, 2021.
- Verduin, J. et al. Enabling Large-Volume Injections in HILIC of Oligonucleotides Through In-Line Mixing. J. Sep. Sci. 2026. DOI: 10.1002/jssc.70372.
Editorial note: Both figures are original LC–MS Guide illustrations created from the mechanisms described in the cited literature. No publisher or manufacturer figure was reproduced.
Leave a Reply