Last updated: September 2026
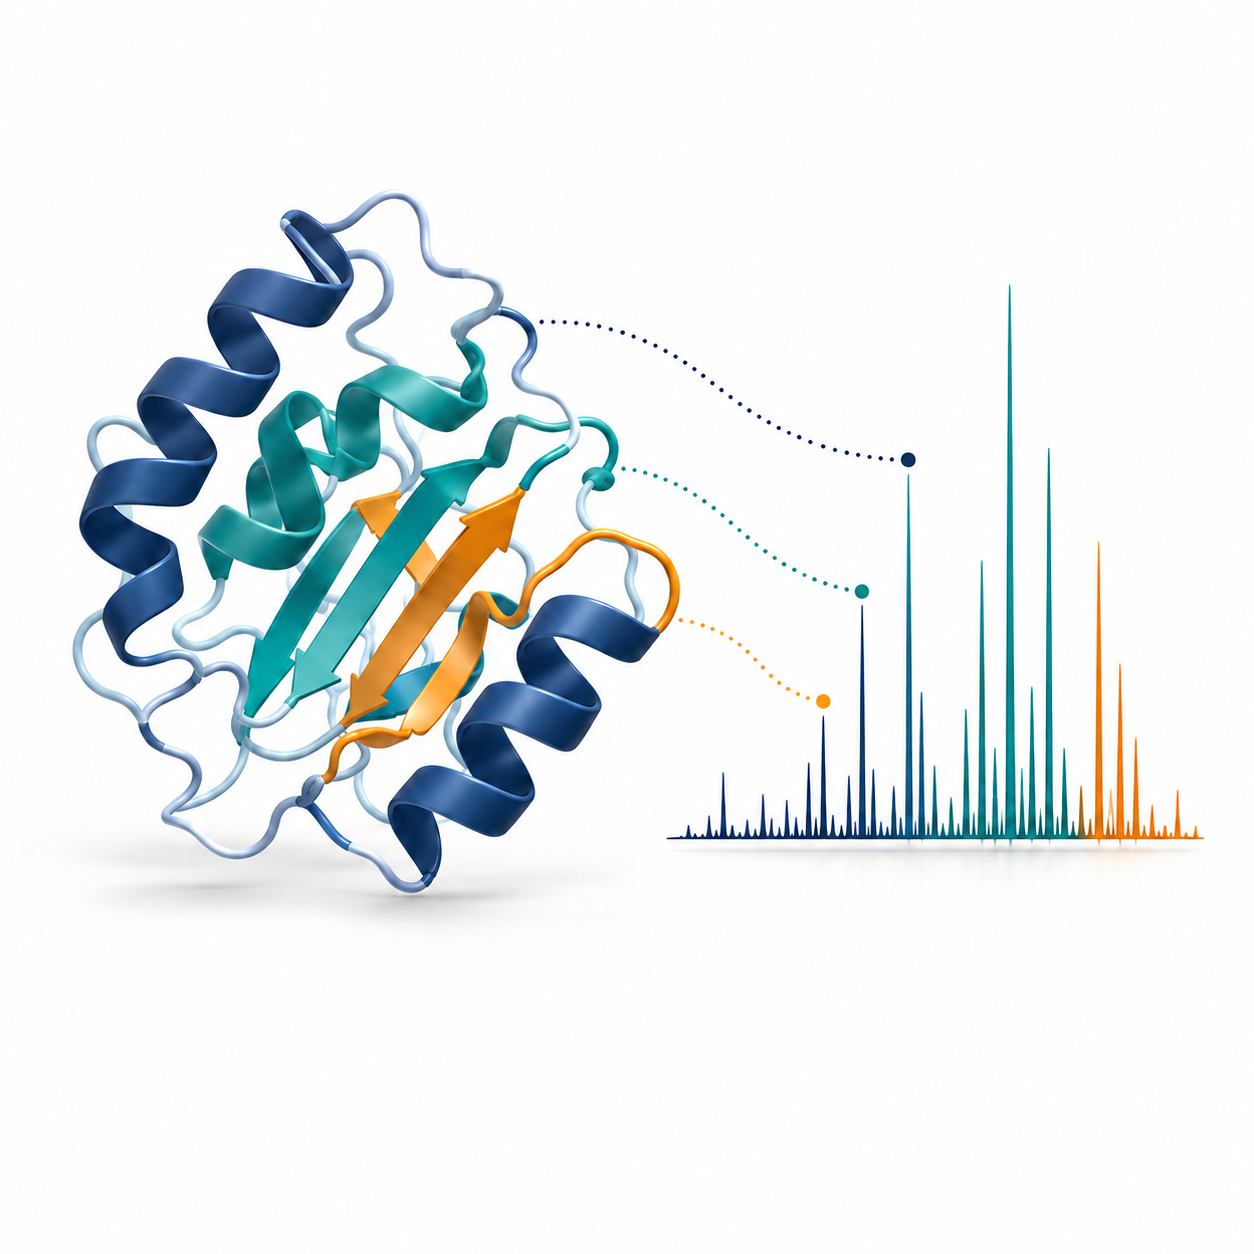
The human genome is often described as a blueprint. But a blueprint does not tell us which rooms are currently occupied, which machines are running, or where a fire has started. For that, biology must be observed closer to the point of action. This is the promise of proteomics: the large-scale measurement of proteins, their abundance, modifications, interactions, structures and locations.
Proteins perform most of the work that creates a biological phenotype. They catalyse reactions, transmit signals, transport molecules, form cellular structures and provide the targets for many medicines. Unlike the genome, however, the proteome is dynamic. It changes with cell type, age, nutrition, infection, medication, environmental exposure and disease. A single gene can also produce multiple protein forms through alternative splicing, proteolytic processing and post-translational modifications.
That combination makes proteomics both difficult and unusually valuable. It can show not only what a biological system could do, but what it appears to be doing at the moment of sampling.
In one sentence: Proteomics is the systematic study of the proteins present in a biological system, including their quantities, molecular forms, modifications, interactions and spatial distribution.
What exactly does proteomics measure?
The word “proteome” was introduced to describe the complete protein complement expressed by a genome, cell, tissue or organism under defined conditions.[1] Modern proteomics is not one experiment but a family of related measurement strategies.
| Proteomics question | What is measured? | Typical approach |
|---|---|---|
| Discovery proteomics | Which proteins are present? | LC–MS/MS with database searching |
| Quantitative proteomics | How much does each protein change? | Label-free analysis, SILAC, TMT or DIA |
| PTM proteomics | Which proteins are phosphorylated, glycosylated, acetylated or ubiquitinated? | Selective enrichment followed by LC–MS/MS |
| Interaction proteomics | Which proteins bind or occur near one another? | Affinity purification or proximity labelling |
| Spatial proteomics | Where are proteins located in a cell or tissue? | Imaging, microdissection and MS-based profiling |
| Proteoform analysis | Which intact molecular forms of a protein exist? | Top-down mass spectrometry |
The most common workflow is bottom-up proteomics. Proteins are extracted and usually digested with trypsin. The resulting peptides are separated by liquid chromatography, ionised—most commonly by electrospray—and analysed by tandem mass spectrometry. Software connects the measured peptide fragments back to peptide sequences and then infers the proteins from which they originated.
This strategy is sensitive and scalable, but it can lose information about which modifications and sequence variants originally coexisted on the same intact protein.
In top-down proteomics, intact proteins are introduced into the mass spectrometer and fragmented directly. This can preserve proteoform-level information, but intact proteins are more difficult to separate, ionise, fragment and identify across a wide mass range. The two approaches are therefore complementary rather than competitors.
Why proteomics is a technology for the future
1. Proteins are closer to disease mechanisms than DNA alone
A DNA variant can indicate inherited risk, but it does not automatically reveal whether the encoded protein is abundant, active, modified or located in the right cellular compartment. RNA abundance is also not a perfect substitute for protein abundance.
Translation, degradation, secretion and post-translational modification add several regulatory layers between a transcript and its biological effect. Proteomics therefore provides information that genomics and transcriptomics cannot supply alone.[2]
2. Most drug mechanisms ultimately involve proteins
Receptors, enzymes, ion channels, antibodies and protein complexes dominate pharmacology. Measuring thousands of proteins can reveal whether a drug reaches its intended pathway, which compensatory pathways become active and which patients express the relevant target.
Proteogenomics goes a step further by integrating genomic alterations with RNA, protein and phosphorylation data. In breast cancer, for example, the CPTAC programme showed that proteomic and phosphoproteomic measurements add functional information to genomic tumour classification.[18]
3. A blood sample contains signals from many organs
Plasma proteins can report inflammation, tissue injury, metabolism and immune activity. The challenge is an enormous concentration range: albumin and immunoglobulins dominate the sample, whereas many signalling proteins occur at far lower concentrations.
Even so, large affinity-based studies are demonstrating the scale of the opportunity. The UK Biobank Pharma Proteomics Project measured 2,923 proteins in 54,219 participants and linked the results to genetics and health phenotypes.[24]
This is a discovery resource—not proof that every association is a clinically useful test—but it enables disease-risk research and genetically supported target discovery at population scale.
4. Diseases are mixtures of different cells
A conventional tissue proteome is an average. A small drug-resistant tumour population or activated immune-cell subset can disappear inside that average. Single-cell and spatial proteomics aim to retain cellular identity and tissue context. This is particularly important in cancer, neurobiology, immunology and developmental biology.
The inventions that made modern proteomics possible
High-resolution protein separation
In 1975, Patrick O’Farrell demonstrated high-resolution two-dimensional gel electrophoresis, combining isoelectric focusing with separation by molecular mass.[3] Thousands of protein spots could be displayed on a gel.
The method had limitations in throughput, quantification and coverage, but it established the idea of surveying complex protein mixtures globally.
Soft ionisation: MALDI and electrospray
Traditional ionisation methods often fragmented large biomolecules before their intact masses could be measured. Matrix-assisted laser desorption/ionisation and electrospray ionisation changed that.
MALDI enabled the mass analysis of large proteins from a matrix-coated target,[4] while ESI generated multiply charged ions from proteins in solution, bringing large biomolecules within accessible mass-to-charge ranges.[5]
These soft-ionisation approaches were foundational for biological mass spectrometry.
Shotgun proteomics and multidimensional LC
Instead of attempting to separate intact proteins first, shotgun proteomics digests the mixture and identifies peptides by LC–MS/MS.
Multidimensional Protein Identification Technology—MudPIT—demonstrated that complex proteomes could be analysed through multidimensional chromatography directly coupled to tandem mass spectrometry.[6] This helped move proteomics from gel spots toward large, automated datasets.
By 2014, large international datasets had produced draft maps of protein expression across human tissues, illustrating how far coverage and computational integration had progressed.[13]
These maps were not a final, complete human proteome: tissue specificity, rare proteins and proteoforms remain moving targets.
High-resolution analysers and the Orbitrap
The Orbitrap introduced high-resolution, accurate-mass analysis based on electrostatic orbital trapping.[7] Later hybrid instruments combined accurate precursor measurement, fast isolation and multiple fragmentation modes.
High resolution does not solve identification by itself, but it narrows candidate formulas, separates near-isobaric ions and increases confidence in complex peptide spectra.
Quantitative labels
Early discovery proteomics was much better at identifying proteins than measuring precise changes. Stable isotope labelling by amino acids in cell culture, known as SILAC, introduced labelled amino acids metabolically, allowing samples to be mixed and compared in the same analysis.[8]
Isobaric tags such as iTRAQ—and later TMT—enabled several samples to be multiplexed in one experiment.[9] Label-free methods subsequently became more reproducible and scalable as chromatography, mass spectrometers and algorithms improved.
Data-independent acquisition
In data-dependent acquisition, the instrument selects only a subset of visible precursors for fragmentation. The selection can vary from run to run.
Data-independent acquisition systematically fragments broad precursor windows. SWATH-MS demonstrated how DIA could generate consistent quantitative records across complex samples.[10]
Modern algorithms and ion-mobility approaches such as DIA-NN and diaPASEF have substantially improved sensitivity, identification and computational analysis.[11][12]
Where proteomics has already helped patients
Faster identification of infectious organisms
MALDI-TOF microbial identification is one of the clearest clinical successes connected to protein mass spectrometry. Characteristic protein fingerprints allow cultured bacteria and fungi to be identified much faster than many conventional biochemical workflows.
A large routine study demonstrated the feasibility of identifying clinical isolates by MALDI-TOF.[14] More importantly, a clinical intervention study found that rapid MALDI-TOF identification combined with antimicrobial-stewardship involvement shortened the time to effective therapy and improved clinical outcomes in bloodstream infections.[15]
The benefit came from the complete workflow: rapid measurement plus rapid clinical action.
Correctly typing amyloid deposits
Amyloidosis is not a single disease. Different precursor proteins can form deposits, and the correct treatment depends on identifying the responsible protein.
Laser microdissection followed by tandem mass spectrometry established a highly specific approach for typing amyloid directly in tissue.[16] This is a strong example of proteomics solving a diagnostically difficult problem with immediate therapeutic consequences.
Blood biomarkers for Alzheimer’s pathology
Mass-spectrometric immunoprecipitation methods helped show that plasma amyloid-β peptide ratios can predict brain amyloid burden measured by positron-emission tomography.[17]
Current Alzheimer’s blood testing also includes non-MS immunoassays, so the broader clinical advance should not be attributed to proteomics alone. Nevertheless, the MS work provided important analytical evidence that a minimally invasive blood signature could reflect pathology in the brain.
Functional interpretation of cancer genomes
Large cancer proteogenomics projects integrate mutations and copy-number changes with protein abundance and phosphorylation. The value is not simply adding another molecular layer.
Protein and phosphosite measurements can reveal activated pathways that are not obvious from DNA alone, suggest therapeutic vulnerabilities and help separate tumours with superficially similar genomic classifications.[18]
Clinical translation remains uneven, but the approach is now central to understanding why the same mutation does not always produce the same functional state.
The newest proteomics trends
1. Single-cell proteomics is moving from demonstration to biology
SCoPE-MS showed that carrier-assisted multiplexing could support mass-spectrometric protein analysis of individual mammalian cells.[19]
Subsequent developments improved sample preparation, throughput and quantitative consistency. plexDIA combined non-isobaric multiplexing with DIA to increase throughput while preserving single-cell information.[20]
Reviews published in 2025 now discuss the field as an emerging analytical platform rather than a single proof of concept.[27]
The remaining challenge is depth. A cell contains a limited amount of protein and, unlike DNA, proteins cannot be amplified by PCR. Missing values, adsorption losses, ion competition and batch effects therefore matter enormously.
Single-cell proteomics is most convincing when experimental design, negative controls and orthogonal biological validation are as strong as the instrument.
2. Spatial proteomics retains tissue architecture
Deep Visual Proteomics combines high-resolution imaging, artificial-intelligence-assisted cell classification, laser microdissection and ultrasensitive MS-based proteomics.[21]
Instead of homogenising an entire biopsy, investigators can select defined cell populations based on morphology and analyse their proteomes. MALDI imaging and spatially resolved proximity-labelling strategies offer complementary routes.
The trend is toward maps in which molecular depth remains connected to histological context.
3. DIA, ion mobility and faster instruments are increasing throughput
DIA is becoming a default choice for many quantitative studies because it reduces stochastic precursor selection. Ion mobility adds a gas-phase separation dimension, while parallel analyser designs increase acquisition speed.
The Orbitrap Astral architecture, for example, was introduced for high-throughput quantitative proteomics by acquiring high-resolution precursor and fast fragment-ion data in parallel.[22]
Scheduled DIA methods reported in 2025 further illustrate the effort to spend instrument time on analytically useful precursor regions rather than collecting every window uniformly.[28]
Faster measurement does not automatically mean better science. Short gradients can increase coelution and interference. Benchmarking must therefore include quantitative precision, missingness, chromatographic robustness and biological reproducibility—not only the number of protein groups reported.
4. Population-scale plasma proteomics is linking proteins to genetics
Large cohort studies combine protein measurements with electronic health data and genome-wide association analysis. In the UK Biobank study, protein quantitative trait loci helped connect genetic variants to circulating protein levels and potential drug targets.[24]
This creates a bridge between association, mechanism and therapeutic hypothesis. However, affinity reagents may be affected by protein-altering variants, and a statistically associated protein is not automatically causal or diagnostically useful.
5. Proteoforms are becoming the next measurement target
The phrase “one gene, one protein” is biologically inadequate. An individual gene can produce many proteoforms that differ by sequence, processing and modification.
The Human Proteoform Project proposed a coordinated effort to build comprehensive proteoform atlases.[23]
Recent top-down studies are beginning to compare intact proteoform patterns directly in disease tissue. A 2025 study coupling capillary-zone electrophoresis to MS/MS reported extensive proteoform differences between Alzheimer’s and control brain samples.[29]
These observations are promising discovery results, not yet validated clinical biomarkers.
An especially ambitious intersection is single-cell top-down proteomics. A 2026 review documents progress in sample handling, separations, instrumentation and computation, while also emphasizing that comprehensive proteoform analysis from individual cells remains technically demanding.[30]
6. Artificial intelligence is becoming part of the analytical pipeline
Machine learning can predict peptide fragmentation spectra and retention behaviour, rescore peptide-spectrum matches, separate true signals from noise and support missing-value-aware analysis.
Prosit showed that deep learning could predict tandem mass spectra with high accuracy and improve peptide identification.[25]
AI does not remove the need for standards, controls or false-discovery-rate estimation. A model trained on particular instruments, collision energies and peptide chemistries has an applicability domain, just like a conventional analytical calibration.
7. Single-molecule protein sequencing is an ambitious frontier
Nanopore and fluorosequencing concepts aim to read individual protein molecules without conventional peptide LC–MS/MS.
A multi-pass nanopore system reported repeated interrogation of the same protein molecule, improving the information obtainable from noisy single-molecule signals.[26]
This direction could eventually complement mass spectrometry, especially for rare proteoforms. It should currently be described as an emerging technology: broad, routine de novo protein sequencing across biological proteomes has not yet been achieved.
What proteomics still cannot do reliably
- Measure every protein: membrane proteins, very low-abundance proteins and extreme proteoforms remain difficult.
- Eliminate pre-analytical bias: collection tubes, processing time, haemolysis, storage and freeze–thaw cycles can change a measured proteome.
- Infer causality from association: a disease-associated protein can be a cause, consequence or unrelated correlate.
- Resolve every proteoform with bottom-up data: identified peptides do not always reveal which modifications coexist on one intact molecule.
- Turn discovery cohorts directly into diagnostics: candidate biomarkers require independent cohorts, analytical validation, clinical cut-offs and proof that they improve patient decisions.
The future of proteomics will therefore depend as much on experimental design and validation as on instrument sensitivity. The most important advance is not merely detecting more proteins. It is generating measurements that remain interpretable across laboratories, patient populations and time.
Conclusion
Proteomics has progressed from protein spots on gels to quantitative maps containing thousands of proteins—and increasingly to individual cells, tissue regions and intact proteoforms.
Its most successful clinical applications demonstrate a consistent principle: the technology creates value when it answers a well-defined biological or medical question and is embedded in a validated decision workflow.
The next decade is likely to be shaped by deeper DIA measurements, larger plasma cohorts, spatial and single-cell analysis, proteoform-resolved methods and AI-assisted interpretation.
Some of these technologies will become routine; others may remain specialist tools. The scientifically defensible expectation is not that proteomics will replace genomics, pathology or clinical chemistry, but that it will connect them more directly to the molecular machinery of disease.
References
- Anderson NL, Anderson NG. Proteome and proteomics: new technologies, new concepts, and new words. Electrophoresis. 1998. doi:10.1002/elps.1150191103
- Aebersold R, Mann M. Mass spectrometry-based proteomics. Nature. 2003. doi:10.1038/nature01511
- O’Farrell PH. High resolution two-dimensional electrophoresis of proteins. Journal of Biological Chemistry. 1975. PubMed
- Karas M, Hillenkamp F. Laser desorption ionization of proteins with molecular masses exceeding 10,000 daltons. Analytical Chemistry. 1988. doi:10.1021/ac00171a028
- Fenn JB, Mann M, Meng CK, Wong SF, Whitehouse CM. Electrospray ionization for mass spectrometry of large biomolecules. Science. 1989. doi:10.1126/science.2675315
- Washburn MP, Wolters D, Yates JR III. Large-scale analysis of the yeast proteome by multidimensional protein identification technology. Nature Biotechnology. 2001. doi:10.1038/85686
- Makarov A. Electrostatic axially harmonic orbital trapping: a high-performance technique of mass analysis. Analytical Chemistry. 2000. doi:10.1021/ac991131p
- Ong SE, et al. Stable isotope labeling by amino acids in cell culture, SILAC, as a simple and accurate approach to expression proteomics. Molecular & Cellular Proteomics. 2002. doi:10.1074/mcp.M200025-MCP200
- Ross PL, et al. Multiplexed protein quantitation in Saccharomyces cerevisiae using amine-reactive isobaric tagging reagents. Molecular & Cellular Proteomics. 2004. doi:10.1074/mcp.M400129-MCP200
- Gillet LC, et al. Targeted data extraction of the MS/MS spectra generated by data-independent acquisition. Molecular & Cellular Proteomics. 2012. doi:10.1074/mcp.O111.016717
- Demichev V, Ralser M, Lilley KS. DIA-NN: neural networks and interference correction enable deep proteome coverage in high throughput. Nature Methods. 2020. doi:10.1038/s41592-019-0638-x
- Meier F, et al. diaPASEF: parallel accumulation–serial fragmentation combined with data-independent acquisition. Nature Methods. 2020. doi:10.1038/s41592-020-00998-0
- Kim MS, et al. A draft map of the human proteome. Nature. 2014. doi:10.1038/nature13302
- Seng P, et al. Ongoing revolution in bacteriology: routine identification of bacteria by MALDI-TOF mass spectrometry. Clinical Infectious Diseases. 2009. doi:10.1086/600885
- Huang AM, et al. Impact of rapid organism identification via MALDI-TOF combined with antimicrobial stewardship team intervention in patients with bacteremia and candidemia. Clinical Infectious Diseases. 2013. doi:10.1093/cid/cit498
- Vrana JA, et al. Classification of amyloidosis by laser microdissection and mass spectrometry-based proteomic analysis in clinical biopsy specimens. Blood. 2009. doi:10.1182/blood-2009-07-230722
- Nakamura A, et al. High performance plasma amyloid-β biomarkers for Alzheimer’s disease. Nature. 2018. doi:10.1038/nature25456
- Mertins P, et al. Proteogenomics connects somatic mutations to signalling in breast cancer. Nature. 2016. doi:10.1038/nature18003
- Budnik B, Levy E, Harmange G, Slavov N. SCoPE-MS: mass spectrometry of single mammalian cells quantifies proteome heterogeneity during cell differentiation. Genome Biology. 2018. doi:10.1186/s13059-018-1547-5
- Derks J, et al. Increasing the throughput of sensitive proteomics by plexDIA. Nature Biotechnology. 2022. doi:10.1038/s41587-022-01389-w
- Mund A, et al. Deep Visual Proteomics defines single-cell identity and heterogeneity. Nature Biotechnology. 2022. doi:10.1038/s41587-022-01302-5
- Heil LR, et al. Parallelized acquisition of Orbitrap and Astral analyzers enables high-throughput quantitative analysis. Analytical Chemistry. 2023. doi:10.1021/acs.analchem.3c02856
- Smith LM, Kelleher NL; Consortium for Top-Down Proteomics. A five-year plan for the Human Proteoform Project. Science Advances. 2021. doi:10.1126/sciadv.abk0734
- Sun BB, et al. Plasma proteomic associations with genetics and health in the UK Biobank. Nature. 2023. doi:10.1038/s41586-023-06592-6
- Gessulat S, et al. Prosit: proteome-wide prediction of peptide tandem mass spectra by deep learning. Nature Methods. 2019. doi:10.1038/s41592-019-0426-7
- Brinkerhoff H, et al. Multi-pass nanopore for single-molecule protein sequencing. Nature Methods. 2024. doi:10.1038/s41592-024-02509-x
- Trends in Mass Spectrometry-Based Single-Cell Proteomics. Analytical Chemistry. 2025. doi:10.1021/acs.analchem.5c00661
- Scheduled data-independent acquisition mass spectrometry for global proteomics and proximity labeling. International Journal of Mass Spectrometry. 2025. doi:10.1016/j.ijms.2025.117497
- Coupling CZE, liquid-phase ion mobility, to MS/MS for quantitative top-down proteomics: revealing significant proteoform differences between healthy and Alzheimer’s disease brains. PROTEOMICS. 2025. doi:10.1002/pmic.70041
- Recent advances in top-down proteomics for single-cell research. Mass Spectrometry Reviews. 2026. doi:10.1002/mas.70031
Leave a Reply